
Directly from the publisher, Springer.
At Amazon; Barnes & Noble
| Buy the book | Errata |
| Description | Software |
| Reviews | Sample data files |
| Contents | Contact the authors |
| Sample chapter (pdf) |
|
|
Buy a copy (ISBN: 978-0-387-92124-2):
Directly from the publisher, Springer. At Amazon; Barnes & Noble |
Our aim in this book is to give an overview of the practical aspects of the analysis of QTL mapping experiments based on inbred line crosses, with explicit instructions on the use of the R/qtl software (an add-on package for R). We give some of the details of the statistical methods, but mostly focus on how to get and make sense of results. Real data examples are included throughout.
The intended audience includes scientists who are performing QTL mapping experiments and want to participate directly in the analysis. Some readers will be statisticians analyzing data from QTL experiments with a basic understanding of genetics.
All of the R code used in the book, including the detailed code used to create the figures, is available in files below, under Software. In addition, we have created an R package, R/qtlbook, that contains all of our example data sets (except those already included in R/qtl); it is also available under Software, below.
Q Zhou (2010) Journal of
Statistical Software Vol. 32, Book Review 5 [pdf (133k)]
"In sum, this is a well-written book with carefully chosen and nicely organized topics. It can serve as a good introduction to QTL mapping methodology and a useful practical guide to the R package."
RW Doerge (2010) Biometrics
66(2):658-659 [html
| pdf
(152k)]
"The authors should be commended on presenting a well-written book that is understandable, and in-depth enough, to be considered a responsible treatment of QTL mapping for anyone who is interested."
Jinx (Leslie Turner, personal communication) [jpeg]
"Meow."
Detailed contents as PDF: contents.pdf
| 1 | Introduction | |
| 2 | Importing and simulating data [Sample chapter (pdf)] | |
| 3 | Data checking | |
| 4 | Single-QTL analysis [Sample chapter (pdf)] | |
| 5 | Non-normal phenotypes | |
| 6 | Experimental design and power | |
| 7 | Working with covariates | |
| 8 | Two-dimensional, two-QTL scans | |
| 9 | Fit and exploration of multiple-QTL models | |
| 10 | Case study I | |
| 11 | Case study II | |
| A | Installing R and R/qtl | |
| B | List of functions in R/qtl [pdf] | |
| C | QTL mapping data sets | |
| D | Hidden Markov models for QTL mapping |
| Old name | New name |
plot.errorlod |
plotErrorlod |
plot.geno |
plotGeno |
plot.info |
plotInfo |
plot.missing |
plotMissing |
plot.pheno |
plotPheno |
plot.pxg |
plotPXG |
plot.rf |
plotRF |
If you have old scripts that use these function names, add the following code at the top:
source("https://rqtl.org/dotfunc.R")
Individuals 5 and 138 have identical genotypes at all 86 markers at which they were both typed; individuals 12 and 55 have the same genotype at 75/76 markers.
should be replaced with
Individuals 12 and 55 have identical genotypes at all 86 markers at which they were both typed; individuals 5 and 138 have the same genotype at 75/76 markers.
That is, we had the two pairs reversed.
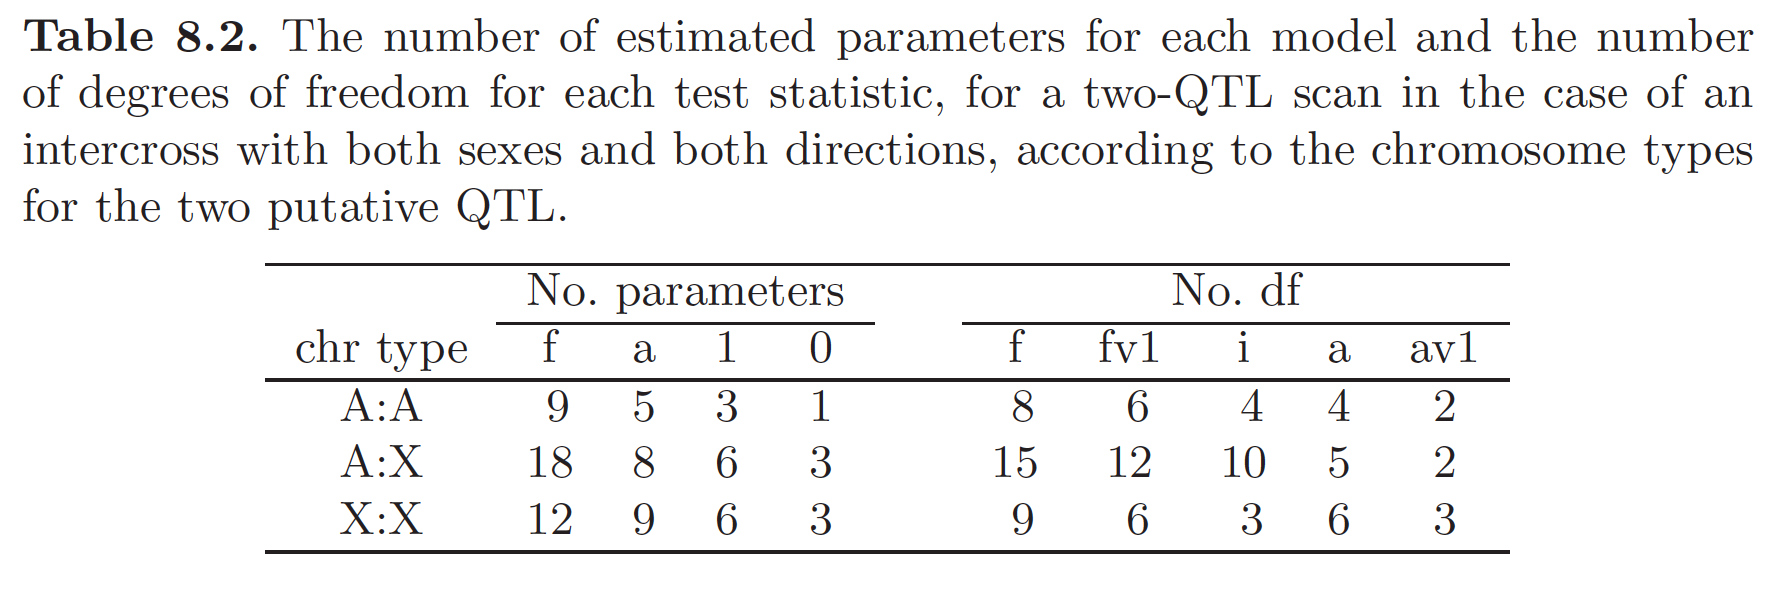
The number of degrees of freedom for LODa for A:X should be 8 – 3 = 5 (not 8).
The number of degrees of freedom for LODfv1 for X:X should be 12 – 6 = 6 (not 3).
The table should appear as follows.
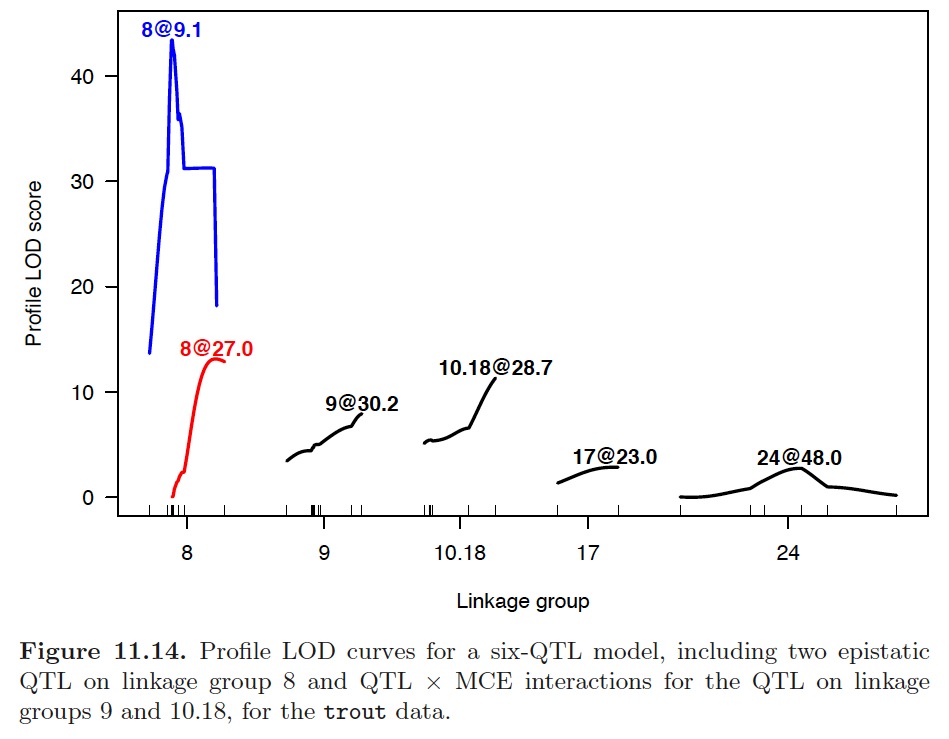
The figure should appear as follows. (Click the image to see a larger version.)
Pr(O=C | G=AA) = ε (not ε/2)
Pr(O=D | G=BB) = ε (not ε/2)
The table should appear as follows.

R/qtl web page [Download page]
R/qtlbook package (with the example data used in the book): [cran | github]
R/qtlDesign package: [cran | r-forge | github]
R code from the book:
| Chapter | File(s) | ||||
| 2 | Importing and simulating data | chap02.R
| |||
| 3 | Data checking | chap03.R
| |||
| 4 | Single-QTL analysis | chap04.R
| |||
| 5 | Non-normal phenotypes | chap05.R,
scanone_cph.R
| |||
| 6 | Experimental design and power | chap06.R
| |||
| 7 | Working with covariates | chap07.R
| |||
| 8 | Two-dimensional, two-QTL scans | chap08.R
| |||
| 9 | Fit and exploration of multiple-QTL models | chap09.R
| |||
| 10 | Case study I | chap10.R
| |||
| 11 | Case study II | chap11.R
| |||
Detailed R code for all figures in the book:
| Chapter | File(s) | ||||
| 1 | Introduction | fig01.R,
meiosis_func.R
| |||
| 2 | Importing and simulating data | fig02.R
| |||
| 3 | Data checking | fig03.R
| |||
| 4 | Single-QTL analysis | fig04.R
| |||
| 5 | Non-normal phenotypes | fig05.R
| |||
| 6 | Experimental design and power | fig06.R
| |||
| 7 | Working with covariates | fig07.R
| |||
| 8 | Two-dimensional, two-QTL scans | fig08.R
| |||
| 9 | Fit and exploration of multiple-QTL models | fig09.R
| |||
| 10 | Case study I | fig10.R
| |||
| 11 | Case study II | fig11.R
| |||
All of the code from the book compressed into one file: RqtlBook_Code.tgz
Samples of data files for import into R/qtl, in a variety of formats and with the necessary R code, are available here.
| Karl W. Broman | Śaunak Sen | |
| Department of Biostatistics and Medical Informatics | Department of Preventive Medicine | |
| University of Wisconsin-Madison | University of Tennessee Health Sciences Center | |
| kbroman at wisc.edu | sen at uthsc.edu |