[ Home | Download | FAQ | News | Bugs | Sample data | Tutorials | Book | Manual | Citation ]
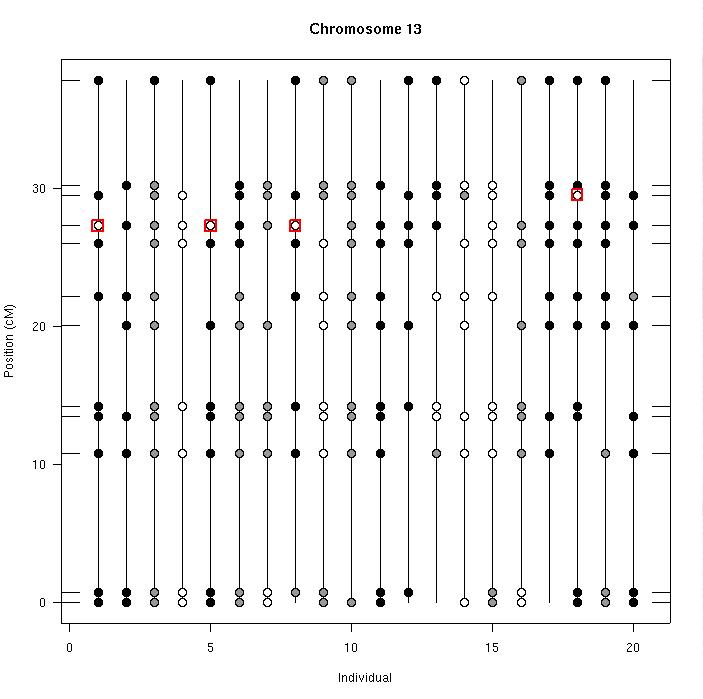
Observed marker genotype data for an intercross. White, gray and black circles correspond to the genotypes AA, AB, and BB, respectively. Genotypes flagged by red squares were indicated to be likely genotyping errors.
[ Home | Download | FAQ | News | Bugs | Sample data | Tutorials | Book | Manual | Citation ]